What if a well-attended event looks like a poor investment simply because its value hasn’t been measured clearly? An event ROI calculator excel workbook can bring costs, outcomes and assumptions into one view. For the result to be credible, distinguish direct financial returns from event influence and longer-term outcomes.
Event costs span the full lifecycle, sales and leads can be difficult to attribute, and outcomes such as stronger relationships or brand awareness don’t always translate into immediate revenue. A single ROI figure can hide those distinctions rather than resolve them.
This guide shows you how to build a practical Excel workbook with clear inputs and checkable formulas. You’ll learn how to organise event costs, record measurable outcomes, document attribution assumptions and report qualitative value separately from financial return. You’ll also find a repeatable way to compare events and use the results to inform future plans.
Key Takeaways
- Set up an event ROI calculator excel workbook with separate areas for assumptions, costs, outcomes and summary results, making each figure easier to trace.
- Choose a measurement method that fits the event objective, and state the evidence source and timeframe used to attribute revenue.
- Check budget, registration, attendance, lead and follow-up records before relying on the result. Confirm which data is available and complete.
- Use consistent definitions, timeframes and attribution rules when comparing events, then interpret results alongside relevant non-financial indicators.
Table of Contents
- Event ROI calculator Excel: what should the model measure?
- Build an event ROI calculator in Excel: workbook tabs, inputs and formulas
- Compare event ROI methods: revenue attribution, cost per outcome and wider impact
- Enter and check event data before trusting your Excel ROI result
- Turn event ROI calculator findings into better event decisions
Event ROI calculator Excel: what should the model measure?
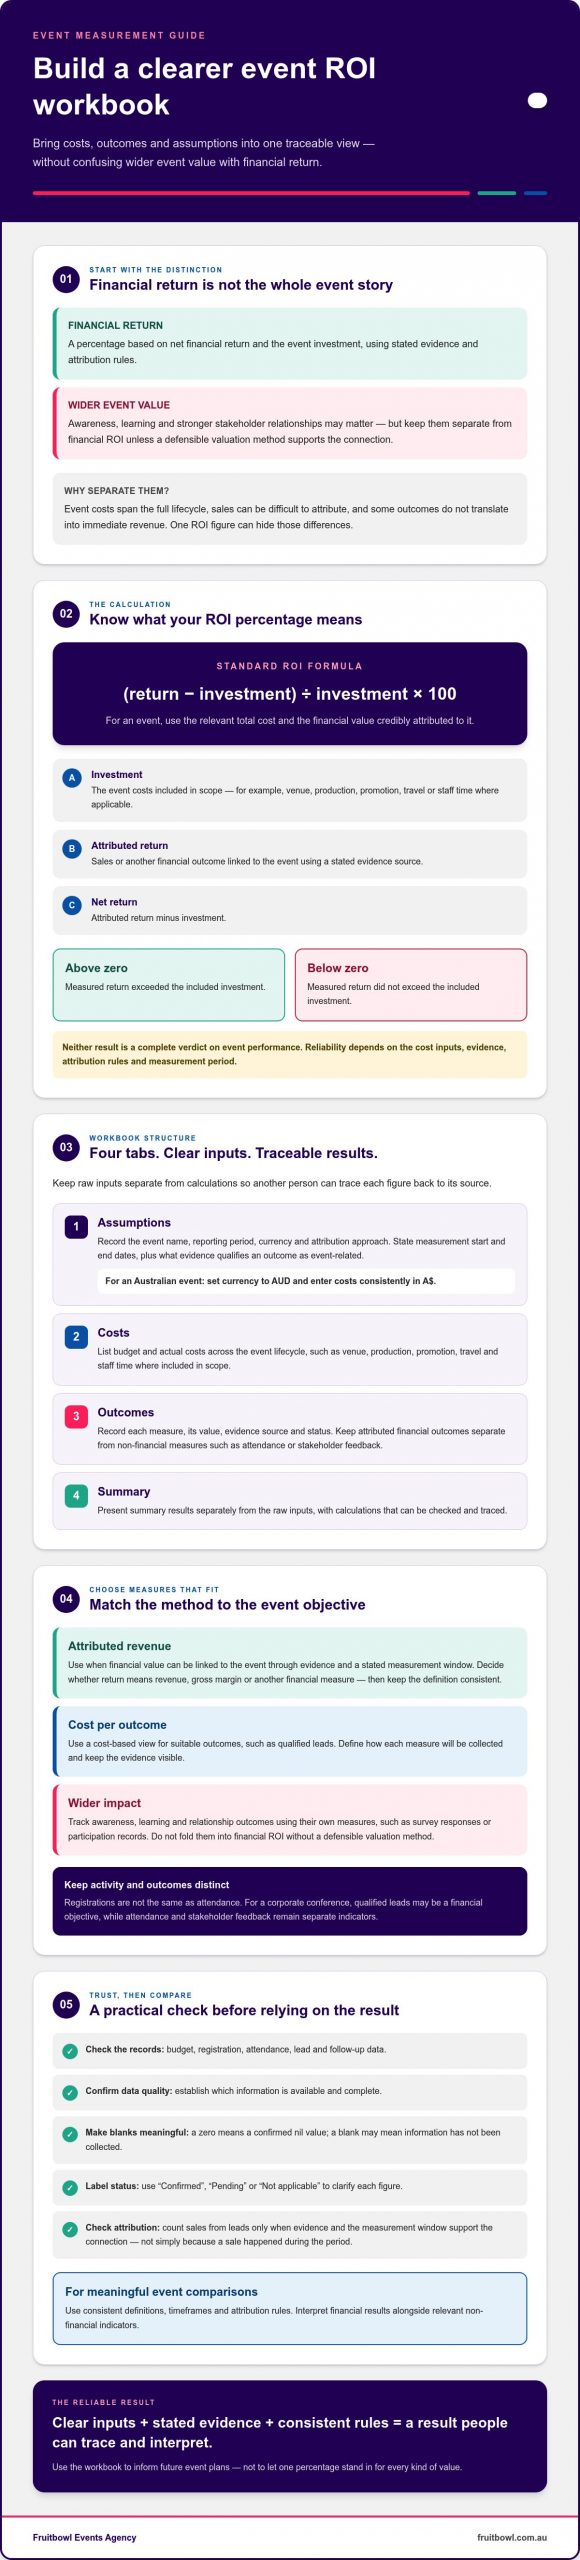
A useful event ROI model measures more than what was spent and what came in. It separates financial return, expressed as a percentage, from broader event value such as increased awareness, learning or stronger stakeholder relationships. Those wider outcomes may support business goals, but don’t present them as revenue unless there’s evidence to substantiate the connection.
Featured snippet definition: Event ROI is the net financial return attributed to an event, divided by the event’s investment and multiplied by 100. It measures financial performance only within the selected timeframe and attribution rules.
What is event ROI, and what does the percentage mean?
The standard Return on Investment (ROI) formula is (return − investment) ÷ investment × 100. For an event, investment is the relevant total cost, while return is the financial value credibly attributed to it. Decide whether that value means revenue, gross margin or another financial measure, and use the same definition when comparing events. If an event generates qualified leads, count sales from those leads only when your evidence and measurement window support the connection.
In an event ROI calculator excel model, label each input before calculating:
- Investment: the event costs included in scope, such as venue, production, promotion, travel or staff time where applicable.
- Attributed return: the value of sales or other financial outcomes linked to the event using a stated evidence source.
- Net return: attributed return minus investment.
A percentage above zero indicates that measured return exceeded the included investment; a result below zero indicates it did not. Neither is a complete verdict on event performance. The percentage is only as reliable as its cost inputs, evidence and attribution rules. Set a measurement period, such as the agreed follow-up window for event-generated leads, and apply it consistently. Don’t count every sale during that period as event-driven without evidence.
Which event objectives belong in an ROI calculator?
Start with the objective the event was designed to achieve: qualified leads, sales, attendance or stakeholder engagement. For a corporate conference, you might track qualified leads as a financial objective, then record attendance and stakeholder feedback as separate indicators. Define how each measure will be collected before the event, and distinguish outcomes from activity: registrations, for instance, aren’t the same as attendance.
Financial objectives can be assessed through attributed revenue or cost per outcome. Awareness, learning and relationship outcomes need their own measures, such as survey responses or participation records, and shouldn’t be folded into financial ROI without a defensible valuation method. This gives decision-makers a clearer view of both financial return and wider value. For further guidance on setting objectives, see evaluating corporate event ROI.
Build an event ROI calculator in Excel: workbook tabs, inputs and formulas
Build the workbook so another person can trace each figure back to its source. An event ROI calculator excel model can use four tabs: Assumptions, Costs, Outcomes and Summary. Keep raw inputs separate from calculations, and check the logic before adding charts or styling.
Set up clear tabs and event-specific input fields
On the Assumptions tab, record the event name, reporting period, currency and attribution approach. For an Australian event, set the currency to AUD and enter costs consistently in A$. State the measurement start and end dates, and explain what evidence qualifies an outcome as event-related.
Use the Costs tab for itemised budget and actual costs across the event lifecycle, such as venue, production, promotion, travel and staff time where included in your chosen scope. On Outcomes, record each measure, its value, evidence source and status. Keep attributed financial outcomes in a dedicated column, separate from non-financial measures such as attendance or stakeholder feedback.
Leave unknown figures visibly incomplete rather than entering zero. A zero means a confirmed nil value; a blank may mean the information hasn’t been collected. Use a status field such as “Confirmed”, “Pending” or “Not applicable” to make that distinction clear.
Add Excel formulas, checks and a readable summary
For example, place cost categories in Costs!B2:B50 and their A$ amounts in Costs!C2:C50. Put attributed financial values only in Outcomes!C2:C50, with evidence notes in the next column. On Summary, label the calculation inputs and outputs: total investment in B2, attributed return in B3, net return in B4 and ROI in B5.
- Total investment:
=SUM(Costs!C2:C50) - Attributed return:
=SUM(Outcomes!C2:C50) - Net return:
=B3-B2 - ROI:
=IF(B2>0,B4/B2,"Check investment input"), formatted as a percentage.
The event ROI formula is net return divided by total investment, multiplied by 100. The formula above returns a decimal, and percentage formatting displays the equivalent percentage. Check that the investment is greater than zero, and that all included figures use the same currency, event scope and return definition.
Use Excel data validation for controlled entries, such as outcome status, and conditional formatting to flag blanks or inconsistent records. Keep assumptions and key inputs visible beside the summary result. If defining the full event scope is proving difficult, you can explore Fruitbowl’s event management experience for perspective on planning, logistics and delivery.
Compare event ROI methods: revenue attribution, cost per outcome and wider impact
Different event objectives call for different measures. Direct financial ROI can show whether evidenced, event-attributed returns exceeded included costs. Cost per outcome can help assess efficiency when the sales journey continues after the event. Qualitative and engagement measures add context, but they don’t prove financial return. An event ROI calculator excel workbook should keep these results distinct so a single figure doesn’t imply more certainty than the data supports.
| Method | What it answers | What it can’t prove |
|---|---|---|
| Direct financial ROI | How attributed financial return compares with event investment. | That the event caused every associated sale, or that unmeasured benefits have no value. |
| Cost per qualified lead | How much investment was associated with each lead meeting your qualification rule. | Whether those leads will convert or generate revenue. |
| Wider impact measures | Whether the event supported outcomes such as awareness, learning or relationships. | A financial value unless a defensible valuation method is available. |
When should you use direct ROI or cost per lead?
Use direct ROI when you can substantiate both the relevant event costs and the financial outcomes linked to the event. Record the evidence source, such as a CRM campaign record or documented sales follow-up, and define the measurement window. A sale recorded after the event isn’t automatically event-generated. State the basis for attribution and apply it consistently.
When sales take longer to mature, cost per qualified lead may be more useful in the short term. Divide the agreed event investment by the number of leads that meet your defined qualification rule. Set that rule and the follow-up period before comparing events. Otherwise, differences in lead quality or measurement timing can make the comparison misleading.
How should you report brand, learning and relationship outcomes?
Keep relevant measures visible beside, but separate from, financial results. Depending on the event objective, these might include attendance against registrations, survey responses, participation in sessions or feedback from stakeholders. Describe what was measured, how the information was gathered and any limitations, such as incomplete survey responses.
Qualitative feedback can help explain why an outcome matters or guide improvements to a future event. It shouldn’t be converted into an invented dollar value or added to attributed revenue without a defensible method. For events where brand outcomes are central, see this guide to brand activation impact measurement.
Enter and check event data before trusting your Excel ROI result
A formula can only produce a useful result if its inputs are complete, comparable and traceable. Before relying on your event ROI calculator excel, verify where each figure came from, whether it’s actual or estimated, and which person or team supplied it. Missing information should remain visible, not be quietly entered as zero.
What data should you collect before and after an event?
Gather records that match your objectives and measurement scope. These may include the approved budget, final cost records, registration and attendance data, lead records and post-event sales follow-up. Check that each source is available and covers the same event. Delivery records can also help explain cost variances or attendance patterns; see this guide to conference logistics planning.
Use a simple sequence to prepare the workbook:
- Confirm the objective. Specify the outcome being measured and how it will be recognised.
- Set the scope. Record the event, included cost categories, currency and outcome measurement period.
- Collect source records. Check approved budgets against final costs, and registrations against attendance. Add lead and follow-up data where available.
- Label each input. Mark figures as actual, estimated, pending or unavailable. Record the source, collection date and data owner.
- Review gaps and assumptions. Note missing records, attribution limits and any adjustments before interpreting the result.
How can you test assumptions and prevent misleading results?
Run conservative, expected and optimistic scenarios using assumptions you can explain, such as different lead conversion rates. Label each scenario clearly and identify the evidence or judgement behind its inputs. These are sensitivity checks, not forecasts or industry benchmarks. Keep the recorded actual result separate from scenario outputs so estimates aren’t mistaken for achieved performance.
Before comparing scenarios, confirm that costs and outcomes relate to the same event and measurement period. Check that costs haven’t been omitted from one scenario and outcomes aren’t counted twice across records. If a figure is uncertain, show the range or flag it for review rather than presenting a single precise result. This makes the workbook easier for colleagues to assess and update.
For conference planning and delivery that takes measurement inputs into account, explore Fruitbowl’s conference and seminar event management.
Turn event ROI calculator findings into better event decisions
An event ROI result is a decision input, not a verdict on whether an event succeeded. Read it alongside the objective, the assumptions behind the calculation and the wider outcomes recorded. A lower financial return may sit alongside strong attendance, useful stakeholder engagement or learning outcomes. Those indicators add context, but shouldn’t be used to disguise weak financial performance.
Use findings to guide specific planning choices. If qualified leads were strong but follow-up outcomes remain unclear, improve how leads are recorded and tracked. If attendance didn’t support the event’s objective, review the audience strategy or programme. If actual costs differed from the plan, examine which budget assumptions need adjustment. This turns an event ROI calculator excel result into practical questions for the next planning cycle.
Compare events only when their objectives, cost definitions, measurement periods and attribution rules are sufficiently consistent. A conference measured on sales over one follow-up window shouldn’t be ranked directly against a brand activation assessed on immediate engagement. Where methods differ, report the results separately and explain the distinction rather than presenting a misleading league table.
How do you present event ROI to stakeholders?
Keep the summary concise and transparent. Lead with the event objective, the financial calculation and the period assessed. State the key assumptions and any material limitations, such as incomplete follow-up records or outcomes that can’t be confidently attributed. Present financial results in one clearly labelled section, with attendance, engagement, learning or relationship indicators shown separately.
Close with the decisions the analysis supports, such as refining the audience, adjusting programme priorities or reviewing budget allocation. Identify unresolved data gaps and who needs to address them before the next review. This gives stakeholders a clear account of both what the event achieved and how confidently the evidence supports that conclusion.
When should you review the event plan with an experienced partner?
Consider experienced input when event objectives, production choices and measurement plans aren’t aligned. Planning, budget oversight, technical delivery and stakeholder coordination can all affect which records are collected and whether they’re usable afterwards. Agreeing on the information needed before delivery makes it easier to assess performance against the original objective.
Fruitbowl Events Agency brings an end-to-end perspective across corporate events, conferences, festivals, government activations and brand activations, from strategic planning and logistics through to on-site delivery. That experience can help connect event planning with practical measurement, without implying a guaranteed financial outcome. Discuss an event with Fruitbowl to explore how planning and delivery can support clearer evaluation.
Make your next event easier to measure
A practical event ROI calculator excel model gives you more than a percentage. It makes costs, attributed financial outcomes and broader event value easier to review separately, while showing the assumptions behind each result. The value comes from using consistent definitions and measurement periods, then treating the calculation as one input to planning decisions, not a standalone verdict.
Start with clear objectives, traceable data and formulas that others can check. Then use the findings to refine your audience strategy, programme and budget planning for future events. Keep gaps and uncertainties visible so stakeholders can distinguish confirmed results from estimates.
Those measurement choices are easier to make when considered alongside the full event lifecycle. Fruitbowl has operated in the events industry since 1996, providing end-to-end planning, logistics and on-site delivery for events including corporate events, conferences, festivals, government activations and brand activations.
Discuss your next event with Fruitbowl to explore how thoughtful planning and delivery can support clearer evaluation. With a consistent approach, each event can provide useful evidence for the decisions that follow.
Frequently Asked Questions
How do you calculate event ROI in Excel?
Calculate event ROI in Excel by subtracting the event investment from financial return attributed to the event, then dividing the difference by the investment. Multiply by 100 to express the result as a percentage. In an event ROI calculator Excel model, label the included costs, attributed return, measurement period and attribution approach. This makes it easier to check what the result represents and avoid treating every sale during the period as event-generated.
What formula should an event ROI calculator use?
Use (attributed financial return − total event investment) ÷ total event investment × 100. In Excel, if B2 contains investment and B3 contains attributed return, enter =IF(B2>0,(B3-B2)/B2,"") in the ROI cell and format it as a percentage. The check prevents division by zero, but it doesn’t validate the inputs. Confirm that costs and return use the same currency, event scope and measurement period.
Can event ROI include brand awareness and attendee engagement?
Include brand awareness and attendee engagement in the evaluation, but report them separately from financial ROI unless you have a defensible way to value them financially. You could track awareness through survey responses and engagement through attendance or participation records. State how each measure was collected and note any gaps. These indicators help explain an event’s wider value, but they don’t by themselves prove revenue or establish that the event caused a later sale.
What costs should an event ROI calculator include?
Include the relevant costs across the event lifecycle, using a clearly stated scope. Depending on the event, this may cover venue, production, promotion, travel, staffing and other delivery costs. Distinguish budgeted figures from final actuals, and document any shared costs or exclusions. Record all monetary amounts in the same currency, such as Australian dollars (A$), so the calculation is consistent. A partial cost total can make the resulting ROI appear stronger than it is.
How do you attribute sales or leads to an event?
Attribute sales or leads using a documented evidence source and a defined measurement window. For example, record whether a lead was captured at the event, how it meets your qualification criteria, and whether follow-up records connect it to a later opportunity or sale. Apply the same rules consistently and identify who supplied the data. Don’t assign all revenue recorded after an event to that event without evidence of a credible connection.
Is an event ROI calculator Excel template enough to evaluate an event?
No. An Excel template can organise inputs and apply formulas, but it can’t confirm that the data is complete, the attribution is sound or the selected measures fit the event objective. Review source records, label estimates and assumptions, and keep financial results distinct from wider outcomes such as learning or stakeholder engagement. Use the result alongside those indicators and relevant limitations, rather than treating one percentage as a complete assessment.
How can you compare ROI across different events?
Compare event ROI only when the events use sufficiently consistent definitions, cost scopes, measurement periods and attribution rules. Check that each calculation includes the same types of costs and applies the same standard for qualifying leads or attributing sales. If objectives differ, compare relevant measures such as cost per qualified lead or attendance against target, while explaining the differences. Avoid ranking unlike events on one ROI percentage without context.
What if a well-attended event looks like a poor investment simply because its value hasn’t been measured clearly? An event ROI calculator excel workbook can bring costs, outcomes and assumptions into one view. For the result to be credible, distinguish direct financial returns from event influence and longer-term outcomes.
Event costs span the full lifecycle, sales and leads can be difficult to attribute, and outcomes such as stronger relationships or brand awareness don’t always translate into immediate revenue. A single ROI figure can hide those distinctions rather than resolve them.
This guide shows you how to build a practical Excel workbook with clear inputs and checkable formulas. You’ll learn how to organise event costs, record measurable outcomes, document attribution assumptions and report qualitative value separately from financial return. You’ll also find a repeatable way to compare events and use the results to inform future plans.
Key Takeaways
- Set up an event ROI calculator excel workbook with separate areas for assumptions, costs, outcomes and summary results, making each figure easier to trace.
- Choose a measurement method that fits the event objective, and state the evidence source and timeframe used to attribute revenue.
- Check budget, registration, attendance, lead and follow-up records before relying on the result. Confirm which data is available and complete.
- Use consistent definitions, timeframes and attribution rules when comparing events, then interpret results alongside relevant non-financial indicators.
Table of Contents
- Event ROI calculator Excel: what should the model measure?
- Build an event ROI calculator in Excel: workbook tabs, inputs and formulas
- Compare event ROI methods: revenue attribution, cost per outcome and wider impact
- Enter and check event data before trusting your Excel ROI result
- Turn event ROI calculator findings into better event decisions
Event ROI calculator Excel: what should the model measure?
A useful event ROI model measures more than what was spent and what came in. It separates financial return, expressed as a percentage, from broader event value such as increased awareness, learning or stronger stakeholder relationships. Those wider outcomes may support business goals, but don’t present them as revenue unless there’s evidence to substantiate the connection.
Featured snippet definition: Event ROI is the net financial return attributed to an event, divided by the event’s investment and multiplied by 100. It measures financial performance only within the selected timeframe and attribution rules.
What is event ROI, and what does the percentage mean?
The standard Return on Investment (ROI) formula is (return − investment) ÷ investment × 100. For an event, investment is the relevant total cost, while return is the financial value credibly attributed to it. Decide whether that value means revenue, gross margin or another financial measure, and use the same definition when comparing events. If an event generates qualified leads, count sales from those leads only when your evidence and measurement window support the connection.
In an event ROI calculator excel model, label each input before calculating:
- Investment: the event costs included in scope, such as venue, production, promotion, travel or staff time where applicable.
- Attributed return: the value of sales or other financial outcomes linked to the event using a stated evidence source.
- Net return: attributed return minus investment.
A percentage above zero indicates that measured return exceeded the included investment; a result below zero indicates it did not. Neither is a complete verdict on event performance. The percentage is only as reliable as its cost inputs, evidence and attribution rules. Set a measurement period, such as the agreed follow-up window for event-generated leads, and apply it consistently. Don’t count every sale during that period as event-driven without evidence.
Which event objectives belong in an ROI calculator?
Start with the objective the event was designed to achieve: qualified leads, sales, attendance or stakeholder engagement. For a corporate conference, you might track qualified leads as a financial objective, then record attendance and stakeholder feedback as separate indicators. Define how each measure will be collected before the event, and distinguish outcomes from activity: registrations, for instance, aren’t the same as attendance.
Financial objectives can be assessed through attributed revenue or cost per outcome. Awareness, learning and relationship outcomes need their own measures, such as survey responses or participation records, and shouldn’t be folded into financial ROI without a defensible valuation method. This gives decision-makers a clearer view of both financial return and wider value. For further guidance on setting objectives, see evaluating corporate event ROI.
Build an event ROI calculator in Excel: workbook tabs, inputs and formulas
Build the workbook so another person can trace each figure back to its source. An event ROI calculator excel model can use four tabs: Assumptions, Costs, Outcomes and Summary. Keep raw inputs separate from calculations, and check the logic before adding charts or styling.
Set up clear tabs and event-specific input fields
On the Assumptions tab, record the event name, reporting period, currency and attribution approach. For an Australian event, set the currency to AUD and enter costs consistently in A$. State the measurement start and end dates, and explain what evidence qualifies an outcome as event-related.
Use the Costs tab for itemised budget and actual costs across the event lifecycle, such as venue, production, promotion, travel and staff time where included in your chosen scope. On Outcomes, record each measure, its value, evidence source and status. Keep attributed financial outcomes in a dedicated column, separate from non-financial measures such as attendance or stakeholder feedback.
Leave unknown figures visibly incomplete rather than entering zero. A zero means a confirmed nil value; a blank may mean the information hasn’t been collected. Use a status field such as “Confirmed”, “Pending” or “Not applicable” to make that distinction clear.
Add Excel formulas, checks and a readable summary
For example, place cost categories in Costs!B2:B50 and their A$ amounts in Costs!C2:C50. Put attributed financial values only in Outcomes!C2:C50, with evidence notes in the next column. On Summary, label the calculation inputs and outputs: total investment in B2, attributed return in B3, net return in B4 and ROI in B5.
- Total investment:
=SUM(Costs!C2:C50) - Attributed return:
=SUM(Outcomes!C2:C50) - Net return:
=B3-B2 - ROI:
=IF(B2>0,B4/B2,"Check investment input"), formatted as a percentage.
The event ROI formula is net return divided by total investment, multiplied by 100. The formula above returns a decimal, and percentage formatting displays the equivalent percentage. Check that the investment is greater than zero, and that all included figures use the same currency, event scope and return definition.
Use Excel data validation for controlled entries, such as outcome status, and conditional formatting to flag blanks or inconsistent records. Keep assumptions and key inputs visible beside the summary result. If defining the full event scope is proving difficult, you can explore Fruitbowl’s event management experience for perspective on planning, logistics and delivery.
Compare event ROI methods: revenue attribution, cost per outcome and wider impact
Different event objectives call for different measures. Direct financial ROI can show whether evidenced, event-attributed returns exceeded included costs. Cost per outcome can help assess efficiency when the sales journey continues after the event. Qualitative and engagement measures add context, but they don’t prove financial return. An event ROI calculator excel workbook should keep these results distinct so a single figure doesn’t imply more certainty than the data supports.
| Method | What it answers | What it can’t prove |
|---|---|---|
| Direct financial ROI | How attributed financial return compares with event investment. | That the event caused every associated sale, or that unmeasured benefits have no value. |
| Cost per qualified lead | How much investment was associated with each lead meeting your qualification rule. | Whether those leads will convert or generate revenue. |
| Wider impact measures | Whether the event supported outcomes such as awareness, learning or relationships. | A financial value unless a defensible valuation method is available. |
When should you use direct ROI or cost per lead?
Use direct ROI when you can substantiate both the relevant event costs and the financial outcomes linked to the event. Record the evidence source, such as a CRM campaign record or documented sales follow-up, and define the measurement window. A sale recorded after the event isn’t automatically event-generated. State the basis for attribution and apply it consistently.
When sales take longer to mature, cost per qualified lead may be more useful in the short term. Divide the agreed event investment by the number of leads that meet your defined qualification rule. Set that rule and the follow-up period before comparing events. Otherwise, differences in lead quality or measurement timing can make the comparison misleading.
How should you report brand, learning and relationship outcomes?
Keep relevant measures visible beside, but separate from, financial results. Depending on the event objective, these might include attendance against registrations, survey responses, participation in sessions or feedback from stakeholders. Describe what was measured, how the information was gathered and any limitations, such as incomplete survey responses.
Qualitative feedback can help explain why an outcome matters or guide improvements to a future event. It shouldn’t be converted into an invented dollar value or added to attributed revenue without a defensible method. For events where brand outcomes are central, see this guide to brand activation impact measurement.
Enter and check event data before trusting your Excel ROI result
A formula can only produce a useful result if its inputs are complete, comparable and traceable. Before relying on your event ROI calculator excel, verify where each figure came from, whether it’s actual or estimated, and which person or team supplied it. Missing information should remain visible, not be quietly entered as zero.
What data should you collect before and after an event?
Gather records that match your objectives and measurement scope. These may include the approved budget, final cost records, registration and attendance data, lead records and post-event sales follow-up. Check that each source is available and covers the same event. Delivery records can also help explain cost variances or attendance patterns; see this guide to conference logistics planning.
Use a simple sequence to prepare the workbook:
- Confirm the objective. Specify the outcome being measured and how it will be recognised.
- Set the scope. Record the event, included cost categories, currency and outcome measurement period.
- Collect source records. Check approved budgets against final costs, and registrations against attendance. Add lead and follow-up data where available.
- Label each input. Mark figures as actual, estimated, pending or unavailable. Record the source, collection date and data owner.
- Review gaps and assumptions. Note missing records, attribution limits and any adjustments before interpreting the result.
How can you test assumptions and prevent misleading results?
Run conservative, expected and optimistic scenarios using assumptions you can explain, such as different lead conversion rates. Label each scenario clearly and identify the evidence or judgement behind its inputs. These are sensitivity checks, not forecasts or industry benchmarks. Keep the recorded actual result separate from scenario outputs so estimates aren’t mistaken for achieved performance.
Before comparing scenarios, confirm that costs and outcomes relate to the same event and measurement period. Check that costs haven’t been omitted from one scenario and outcomes aren’t counted twice across records. If a figure is uncertain, show the range or flag it for review rather than presenting a single precise result. This makes the workbook easier for colleagues to assess and update.
For conference planning and delivery that takes measurement inputs into account, explore Fruitbowl’s conference and seminar event management.
Turn event ROI calculator findings into better event decisions
An event ROI result is a decision input, not a verdict on whether an event succeeded. Read it alongside the objective, the assumptions behind the calculation and the wider outcomes recorded. A lower financial return may sit alongside strong attendance, useful stakeholder engagement or learning outcomes. Those indicators add context, but shouldn’t be used to disguise weak financial performance.
Use findings to guide specific planning choices. If qualified leads were strong but follow-up outcomes remain unclear, improve how leads are recorded and tracked. If attendance didn’t support the event’s objective, review the audience strategy or programme. If actual costs differed from the plan, examine which budget assumptions need adjustment. This turns an event ROI calculator excel result into practical questions for the next planning cycle.
Compare events only when their objectives, cost definitions, measurement periods and attribution rules are sufficiently consistent. A conference measured on sales over one follow-up window shouldn’t be ranked directly against a brand activation assessed on immediate engagement. Where methods differ, report the results separately and explain the distinction rather than presenting a misleading league table.
How do you present event ROI to stakeholders?
Keep the summary concise and transparent. Lead with the event objective, the financial calculation and the period assessed. State the key assumptions and any material limitations, such as incomplete follow-up records or outcomes that can’t be confidently attributed. Present financial results in one clearly labelled section, with attendance, engagement, learning or relationship indicators shown separately.
Close with the decisions the analysis supports, such as refining the audience, adjusting programme priorities or reviewing budget allocation. Identify unresolved data gaps and who needs to address them before the next review. This gives stakeholders a clear account of both what the event achieved and how confidently the evidence supports that conclusion.
When should you review the event plan with an experienced partner?
Consider experienced input when event objectives, production choices and measurement plans aren’t aligned. Planning, budget oversight, technical delivery and stakeholder coordination can all affect which records are collected and whether they’re usable afterwards. Agreeing on the information needed before delivery makes it easier to assess performance against the original objective.
Fruitbowl Events Agency brings an end-to-end perspective across corporate events, conferences, festivals, government activations and brand activations, from strategic planning and logistics through to on-site delivery. That experience can help connect event planning with practical measurement, without implying a guaranteed financial outcome. Discuss an event with Fruitbowl to explore how planning and delivery can support clearer evaluation.
Make your next event easier to measure
A practical event ROI calculator excel model gives you more than a percentage. It makes costs, attributed financial outcomes and broader event value easier to review separately, while showing the assumptions behind each result. The value comes from using consistent definitions and measurement periods, then treating the calculation as one input to planning decisions, not a standalone verdict.
Start with clear objectives, traceable data and formulas that others can check. Then use the findings to refine your audience strategy, programme and budget planning for future events. Keep gaps and uncertainties visible so stakeholders can distinguish confirmed results from estimates.
Those measurement choices are easier to make when considered alongside the full event lifecycle. Fruitbowl has operated in the events industry since 1996, providing end-to-end planning, logistics and on-site delivery for events including corporate events, conferences, festivals, government activations and brand activations.
Discuss your next event with Fruitbowl to explore how thoughtful planning and delivery can support clearer evaluation. With a consistent approach, each event can provide useful evidence for the decisions that follow.
Frequently Asked Questions
How do you calculate event ROI in Excel?
Calculate event ROI in Excel by subtracting the event investment from financial return attributed to the event, then dividing the difference by the investment. Multiply by 100 to express the result as a percentage. In an event ROI calculator Excel model, label the included costs, attributed return, measurement period and attribution approach. This makes it easier to check what the result represents and avoid treating every sale during the period as event-generated.
What formula should an event ROI calculator use?
Use (attributed financial return − total event investment) ÷ total event investment × 100. In Excel, if B2 contains investment and B3 contains attributed return, enter =IF(B2>0,(B3-B2)/B2,"") in the ROI cell and format it as a percentage. The check prevents division by zero, but it doesn’t validate the inputs. Confirm that costs and return use the same currency, event scope and measurement period.
Can event ROI include brand awareness and attendee engagement?
Include brand awareness and attendee engagement in the evaluation, but report them separately from financial ROI unless you have a defensible way to value them financially. You could track awareness through survey responses and engagement through attendance or participation records. State how each measure was collected and note any gaps. These indicators help explain an event’s wider value, but they don’t by themselves prove revenue or establish that the event caused a later sale.
What costs should an event ROI calculator include?
Include the relevant costs across the event lifecycle, using a clearly stated scope. Depending on the event, this may cover venue, production, promotion, travel, staffing and other delivery costs. Distinguish budgeted figures from final actuals, and document any shared costs or exclusions. Record all monetary amounts in the same currency, such as Australian dollars (A$), so the calculation is consistent. A partial cost total can make the resulting ROI appear stronger than it is.
How do you attribute sales or leads to an event?
Attribute sales or leads using a documented evidence source and a defined measurement window. For example, record whether a lead was captured at the event, how it meets your qualification criteria, and whether follow-up records connect it to a later opportunity or sale. Apply the same rules consistently and identify who supplied the data. Don’t assign all revenue recorded after an event to that event without evidence of a credible connection.
Is an event ROI calculator Excel template enough to evaluate an event?
No. An Excel template can organise inputs and apply formulas, but it can’t confirm that the data is complete, the attribution is sound or the selected measures fit the event objective. Review source records, label estimates and assumptions, and keep financial results distinct from wider outcomes such as learning or stakeholder engagement. Use the result alongside those indicators and relevant limitations, rather than treating one percentage as a complete assessment.
How can you compare ROI across different events?
Compare event ROI only when the events use sufficiently consistent definitions, cost scopes, measurement periods and attribution rules. Check that each calculation includes the same types of costs and applies the same standard for qualifying leads or attributing sales. If objectives differ, compare relevant measures such as cost per qualified lead or attendance against target, while explaining the differences. Avoid ranking unlike events on one ROI percentage without context.
OUR BLOG
Event Insights & Expertise
Our blog is your go-to resource for all things events. From expert insights and the latest industry trends to practical planning tips, we share everything you need to deliver standout experiences.
Contact Us